Administrator side
Most maintenance operations can be carried out directly via biomaj-cli (documentation here), however it is possible to automate and visualize a number of tasks.
How to update banks?
Standalone version : cron tasks
Microservices:
- release service (biomaj-release)(auto-schedule of banks): Scan every day remote banks release modifications and send stats to prometheus and influxdb about new release detection. When a new release is detected, according to minimal delay configuration (in global or bank properties), a new bank update is sent.
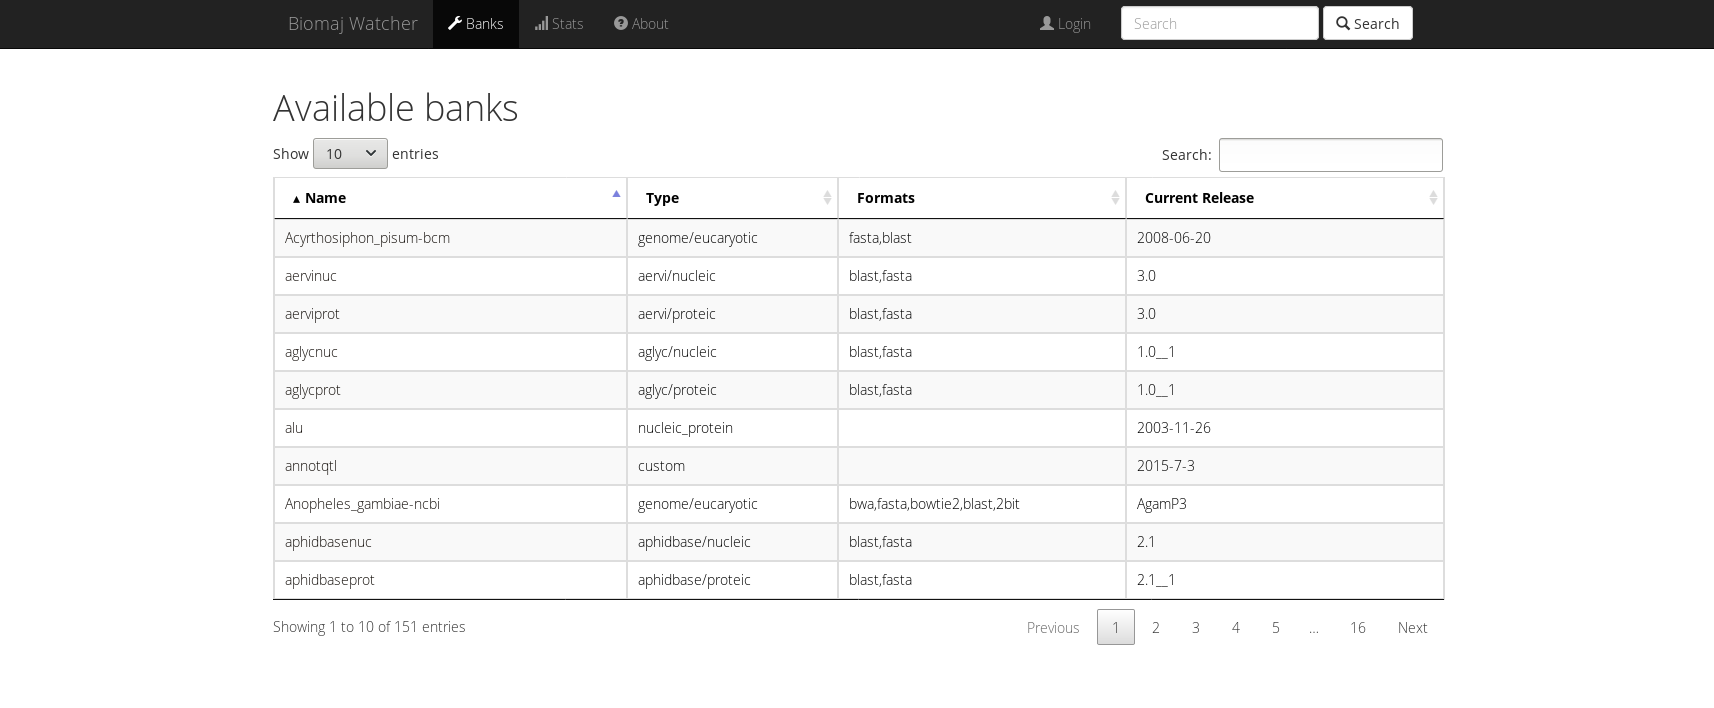
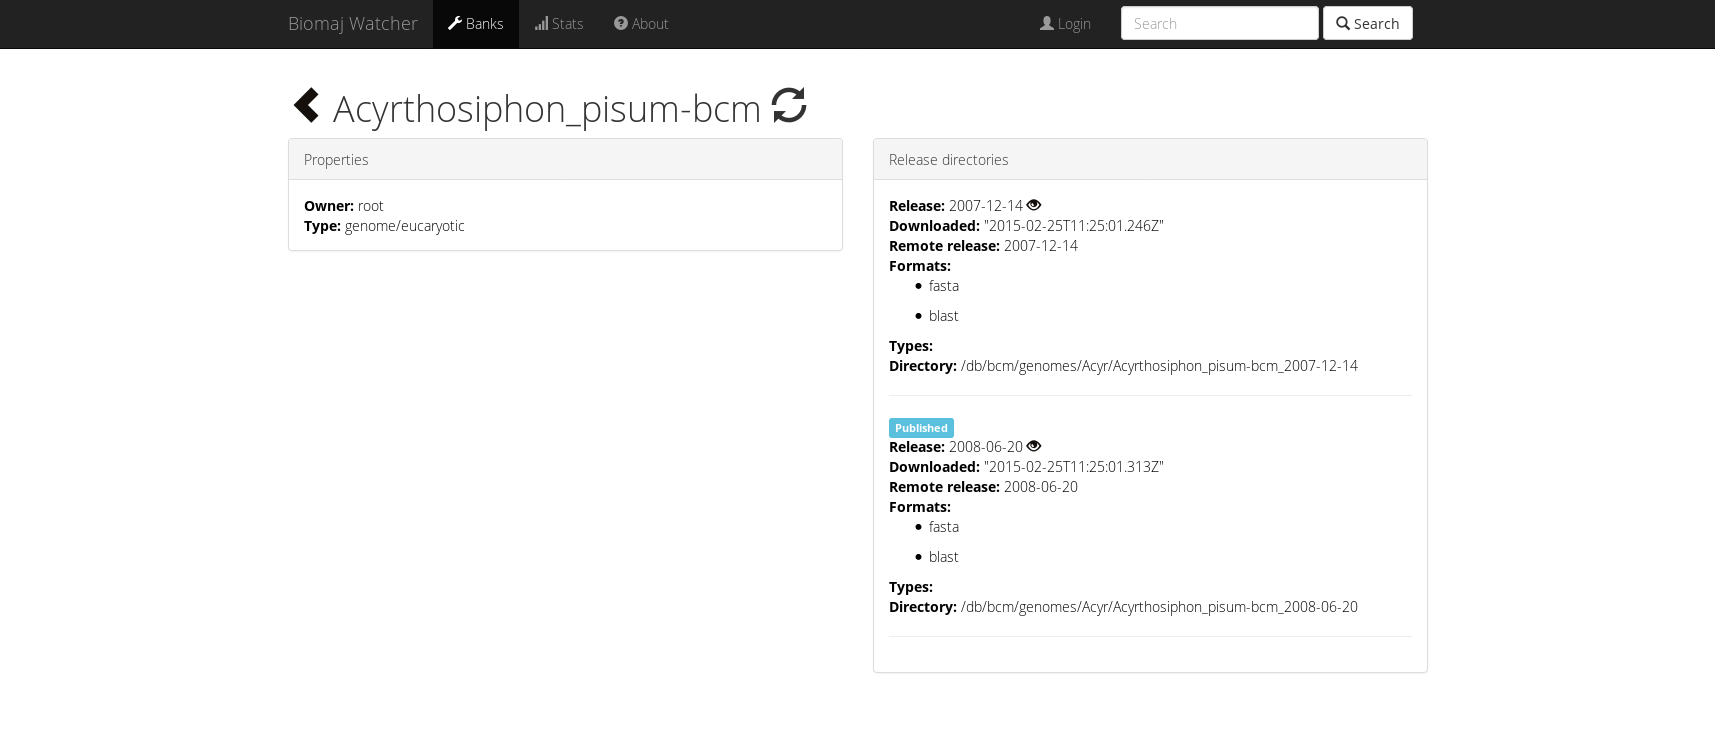
- Cron service, manageable via biomaj-watcher (web ui)
BioMAJ watcher overview:
Notifications
An email is sent to bank owner with update/removal status and log extract, then log can be analysed in log dir (one log per session/command).
How to search basic informations on banks?
Elasticsearch can index bank update session information for search on banks. This indexing is activated via configuration.
How to get BioMAJ running statistics?
Influxdb
- It is possible to get stats of BioMAJ with influxdb
- Influxdb is a time series database designed to analyse and store time-series data.
![]() Do not forget to create influxdb database manually. You will first have to run the CLI influxdb in the influxdb container and then create a biomaj database:
Do not forget to create influxdb database manually. You will first have to run the CLI influxdb in the influxdb container and then create a biomaj database:
docker exec -it biomajdocker_biomaj-influxdb_1 influx
#Connected to http://localhost:8086 version 1.3.0
#InfluxDB shell version: 1.3.0
create database biomaj
Prometheus
- BioMAJ collects metrics with prometheus (time based metrics on execution time of downloads and executions, there are available for biomaj-daemon, biomaj-process and biomaj-download).
Grafana
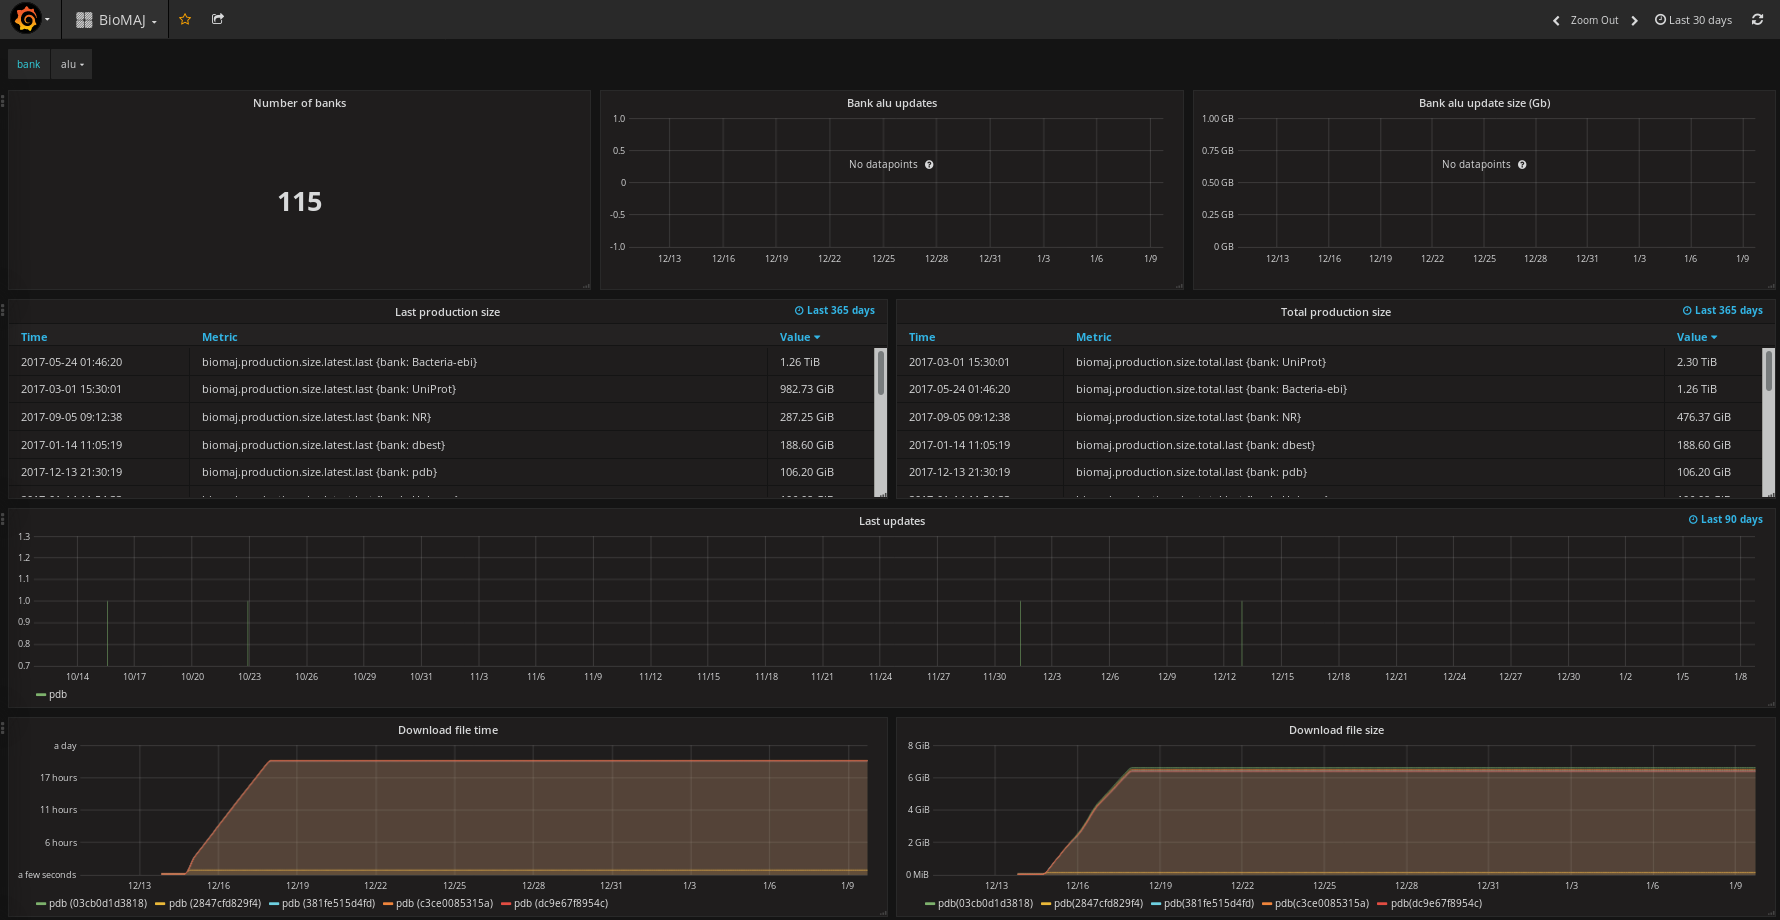
- Grafana is a dashboard that will get the data in influxdb and prometheus. It provides a visualization interface for timeseries records on update, current and past downloads, disk space used per bank, etc.
Grafana for BioMAJ GenOuest:
How to use it?
Add this service to the docker-compose.yml of BioMAJ (find the example here)
grafana:
 image: grafana/grafana
 ports:
 - "3000:3000"
 environment:
GF_SECURITY_ADMIN_PASSWORD: adminm
Other services
- Status info page on public-proxy http://public-proxy/status/index.html
- Graylog: centralisation of the logs of docker containers
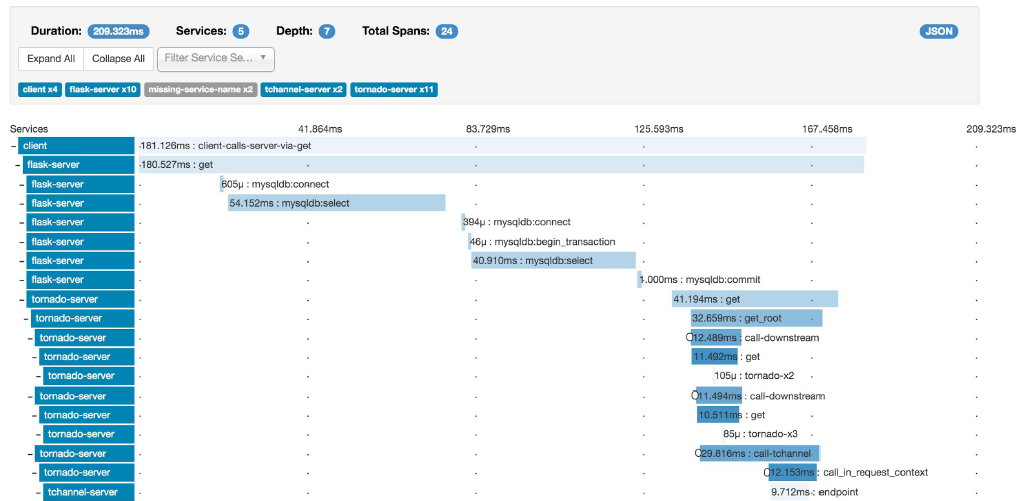
- Zipkin: shows per workflow step info (dependency, time) (Start optional zipkin server and use –trace option on a bank update command)
Debug
What to check in case of a BioMAJ bug?
- Bank logs (<rootdir>/log/bank/version/execution)
- Check the bank status:
biomaj-cli.py --config global.properties --status --bank alu- Check per process logs (logs generated by process or docker logs)